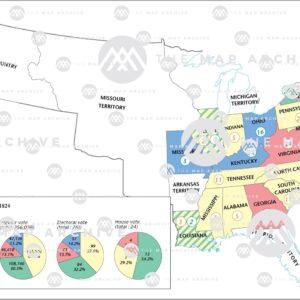
The United States presidential election map is a vivid tapestry that reflects the diverse and complex political landscape of the nation. Every four years, Americans witness a spectacle where states are colored in shades of red and blue, representing the political preferences of their citizens. This electoral cartography serves as a visual guide to the political journey that culminates in the selection of the leader of the free world. In this article, we will delve into the intricacies of the US presidential election map, exploring its historical significance, key battleground states, and the evolving dynamics that shape it.
Historical Context:
The roots of the US presidential election map can be traced back to the inception of the American democratic experiment. Over the years, the map has witnessed remarkable shifts, reflecting changes in demographics, ideologies, and societal norms. Initially, electoral maps were simple and straightforward, with a limited number of states participating. However, as the country expanded westward, so did the complexity of the electoral landscape.
One of the defining features of the electoral map is the concept of the Electoral College, a mechanism designed by the framers of the Constitution to balance the interests of both small and large states. This system allocates a certain number of electoral votes to each state, roughly proportional to its population. Today, a candidate needs to secure at least 270 electoral votes out of the total 538 to win the presidency.
Battleground States:
While the majority of states consistently lean towards one party or the other, a select group of states, known as battleground states or swing states, play a pivotal role in determining the outcome of the election. These states are often characterized by a diverse demographic, a balanced political landscape, and a history of shifting allegiances.
Ohio, Florida, Pennsylvania, Wisconsin, and Michigan are among the most frequently cited battleground states. The candidates devote substantial time, resources, and campaign efforts in these states, recognizing their significance in the pursuit of electoral victory. The diversity of these states, both in terms of demographics and economic interests, makes them crucial bellwethers for gauging the national mood.
Coloring the Map:
The iconic red and blue colors that dominate the US presidential election map are deeply entrenched in political symbolism. The color scheme, which has become a convention in American political discourse, represents the two major political parties – Republicans and Democrats. Red is traditionally associated with the Republican Party, while blue is the color of the Democratic Party.
Over the years, media outlets have adopted this color scheme, making it a consistent and recognizable feature of election coverage. The map, once a tool for political insiders and analysts, has become a visual spectacle for millions of Americans eagerly awaiting the results of the election night. The sea of red and blue, punctuated by the occasional purple of swing states, encapsulates the drama and anticipation of the democratic process.
Changing Demographics and Electoral Shifts:
Demographic changes within the United States have a profound impact on the electoral map. As the country becomes more diverse, with increasing representation from minority communities, the political dynamics are undergoing a transformation. States that were once considered solidly red or blue may experience shifts in allegiance based on evolving demographics and changing voter attitudes.
For example, the "Sun Belt" states in the southern and western parts of the country have seen a population boom, driven in part by migration patterns and demographic changes. This influx of new residents brings with it a shift in political preferences, potentially altering the electoral landscape. Similarly, the suburbs, once reliable Republican strongholds, have shown signs of becoming more competitive as demographics and priorities change.
The Urban-Rural Divide:
One of the defining features of the US presidential election map is the stark contrast between urban and rural areas. Major metropolitan areas, often marked by their blue hue on the electoral map, tend to lean Democratic. These urban centers are characterized by a diverse population, higher levels of education, and a focus on progressive policies.
On the flip side, rural areas, typically depicted in red, tend to favor the Republican Party. These regions often prioritize conservative values, traditional social norms, and economic policies that resonate with agriculture and small-town communities. The urban-rural divide has become a central theme in American politics, shaping the electoral outcomes and influencing policy priorities.
The Role of Media and Technology:
The presentation of the US presidential election map has evolved significantly with advancements in media and technology. In the early days of television, election night coverage was a more static affair, with maps and graphics updated periodically. Today, viewers can witness real-time updates, interactive maps, and in-depth analysis at their fingertips, thanks to the internet and 24-hour news cycles.
Social media platforms also play a crucial role in shaping the narrative surrounding the election map. Trends, hashtags, and user-generated content contribute to the public discourse, amplifying the impact of the electoral map beyond traditional media outlets. The instant dissemination of information and opinions on social media has the power to shape public perception and influence the course of the election.
Conclusion:
The US presidential election map is not merely a visual representation of electoral outcomes; it is a dynamic and evolving snapshot of American democracy. It reflects the diverse tapestry of the nation, with its changing demographics, shifting political allegiances, and the ongoing struggle between urban and rural interests. As we continue to witness the unfolding drama of each election cycle, the map serves as a testament to the resilience and adaptability of the democratic process in the United States.


Comments