


What is a Double Bottom in Forex? A Beginner's Entry Point into Technical Analysis
A double bottom is among the most dependable reversal patterns in technical analysis. This particular chart pattern indicates when a currency pair has most likely reached its lowest point and is about to begin to move up again. Essentially, the market is saying, "I have tested this price twice and it has held- let's go up."
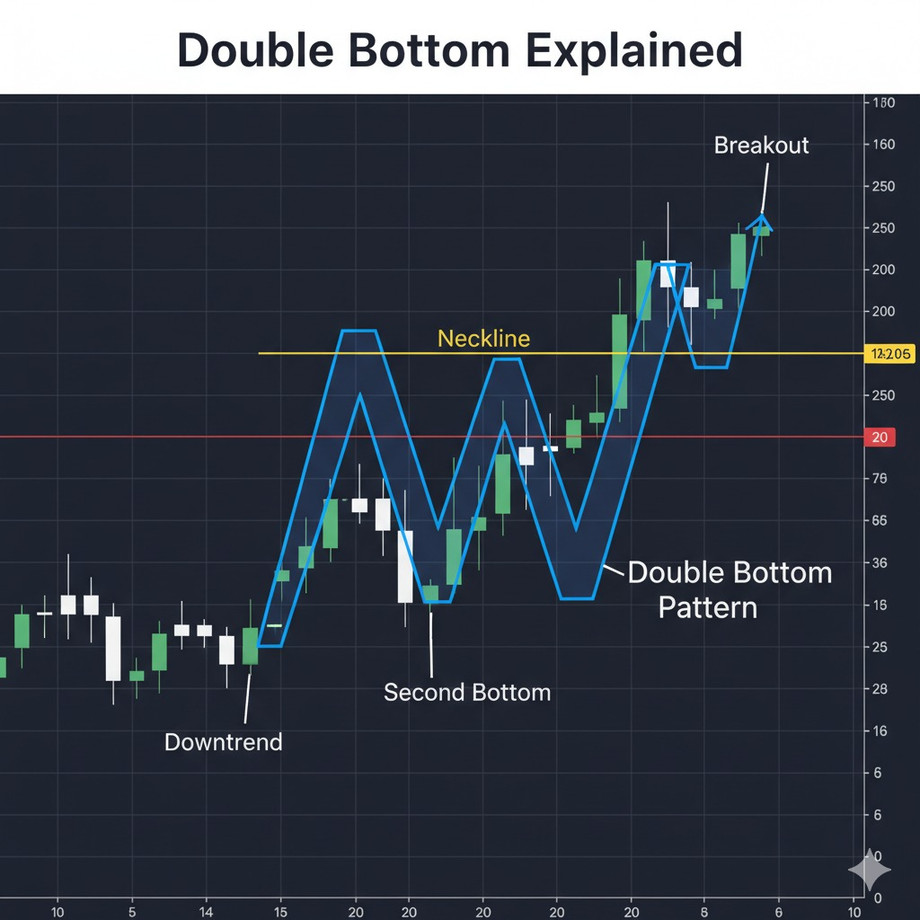
This pattern shows up on your trading chart as a shape that resembles a letter "W". There are two distinct low price levels, "bottoms" that are relatively at the same price level. In between two bottoms, you will see a little recovery, which creates the middle peak of the W. What gives this pattern such value is that it signifies the end of the market's move down, the start of the market's move up.
For foreign exchange (forex) traders, determining double bottoms could be the difference between saying goodbye to a great opportunity and spotting a market that is potentially reversing trend. A double bottom would essentially be like you have a crystal ball that helps you determine where the price might move to at some point in the future, although in trading, nothing is certain, nor will there ever be guarantees.
In this guide, we are going to walk you through everything you need to know about double bottoms, so you will learn what to look for, what causes them, based on real forex market examples, and how to trade with them safely. By the end, you are going to have another useful trading tool to use the next time you are trading.
What is a Double Bottom? Definition, Key Characteristics, and Its Importance in Forex
So, what does double bottom actually mean? Think of a basketball (or any type of ball) bouncing on a flat, concrete surface. When the basketball hits the ground, it bounces back up. Eventually, it will come down again and hit the same flat surface, but then it will launch back up.
The flat concrete surface is strong enough to withstand many impacts as long as it doesn't crack and break apart (or break down). A double bottom is doing exactly that on a forex chart.
A double bottom is a price pattern that occurs after a currency pair has experienced a decline for an extended period. Here is what you will see:
The Setup: We see a clear downtrend, where prices have been consistently going lower over time; this is our first part of the pattern or the "setup."
First Bottom: Prices fall to a low point, then bounce back higher. This is our first bottom of the trough. It is as if the market is checking out how low prices can go.
The Rebound: After prices fall to that first low, they bounce back, but not all the way back, just on the rebound from that first low. It is more like a pause or a reprieve in the selling.
Second Bottom: This is where it gets interesting! Prices fall again, but this time, prices do not break to new lows. Prices slip again, down to around the exact level as the first bottom. This is our second "trough."
The Breakout: The pattern will not be confirmed until prices break out above the highest point in between the two bottoms. This point is considered the "neckline" of the pattern and is confirmation that the downtrend phase has completed.
What is the difference between double bottoms and single bottoms? A single bottom points to one low, capitulate, the price bounces up, but might not signal a strong reversal. While a single bottom can signal some reversal, the degree of reliability is not as strong as a double bottom, simply because the market only tested that level once, but received confidence that the price would be lower. A double bottom is evidence that the intra-order flow pushed potential prices lower two times, all of which failed.
The formation of a double-bottom pattern sets up a sizable part of market psychology. The first bottom reflects sellers driving prices lower with vigour. The bounce back up says buyers, to some extent, are coming into the market on the way back (up). Then, as the price falls back to an appropriate level again and holds, it shows the price area has developed into a 'power zone.' That also means price action buyers are willing to buy at this level, and sellers have lost their juice and are exhausted to push the price lower.
The understanding of this buyer and seller tug-of-war is a setup for the price changing direction. When the neckline breaks, buyers jump in and buy typically. By doing this, they recognise a pattern and then enter 'fuel' for the new trend.
Recognising a Double Bottom in Forex Charts: Process for Identification Step-By-Step
It takes time and practice to learn how to identify double bottoms, but once you know what to look for, they will jump out. Similar to the experience of you learning how to recognise your friend's voice in a group of people, at first you are lost, but eventually you learn to listen in a specific manner to immediately recognise that voice in a crowd. Below is your process for identification broken down into steps:
Step 1: Clear Downtrend Prior to Double Bottom Developing: Prior to seeing a double bottom develop, you want to clearly see a currency pair that has been in a downtrend. It does not have to be 1 month or longer; a currency pair may have been in a downtrend for a few days or weeks and be declining. You want to see lower highs and lower lows on your chart. Without a clear downtrend, you do not have the necessary conditions for double bottom development.
Step 2: Recognise the First Low Point: By looking at price action, you'll know when the price is at a good low point, and then you're looking for a bounce from that low point. The first lower point should be low enough, and not just a quick low point in the low-fresh action; it's possible they creep lower each time. To confirm the first bottom, you will need to see the price bounce from that first bottom. Most likely, the price would move 3-5% from the first low and more for some of the Major currency pairs.
Step 3: Identify the Rebound Peak: After the first bottom, the price will bounce back upward at least to some degree. Identify the highest point of the bounce, and this point will be your possible "neckline". It does not have to be a large bounce necessarily, but there should be evidence that buying power had the upper hand over selling power - even if only momentarily.
Step 4: Find the Second Bottom: This is where the fun begins. Prices should fall back down to basically the same level as the first bottom. The two bottoms do not need to be exactly at the same price—it's okay if there's a little wiggle on the second bottom—but it should be close enough to where you can draw a horizontal line between the two bottoms.
Step 5: Wait for Neckline Confirmation: This is where patience truly pays off. The double bottom pattern isn't complete until prices rally back up above the neckline (that peak between the two bottoms). Many traders make the mistake of being premature and entering too early, only to have the double bottom fail on them.
Timeframe Recognition
Double bottoms are authentic on every timeframe; however, they operate differently from timeframe to timeframe. For instance, on short timeframes, like a 1-hour or 4-hour timeframes, the patterns will develop faster but may not be as physically dependable due to market noise. A daily timeframe and weekly timeframe will create a stronger and generally more reliable double bottom, but at the cost of development time.
Using Confirming Tools
Smart traders do not rely solely on the pattern. More often than not, when the neckline is broken, the volume increases because more traders are involved in the breakout. Based on the trading activity on the chart, the MACD may show bullish divergence, meaning it is making higher lows while the price is making lows that are approximately similar. The RSI may show oversold at the bottom, but the RSI may build strength again once the price breaks the neckline.
Not every dip will form a double bottom. Some dips will form a triple bottom, and others may fail and break down the prior low. Some dips may simply move sideways. This is why it is helpful to wait for confirmation. Confirmation helps eliminate false signals; otherwise, a lot of cash will be lost in the trading account.
For more info :-
Comments